[1.5.0] - Release Notes
This release upgrades the biometric engine: adding support for JPEG 2000 images and the response time has been decrease improving the performance of the service.
Engine improvements from version 1.2.0 to 1.5.0
- Significant improvements in processing speed and robustness; allowing it to operate with lower resolution images, cropped images, automatic image rotation, etc.
- The size of Docker is considerably reduced, going from 1.15GB to 211MB.
- Docker vulnerabilities fixed.
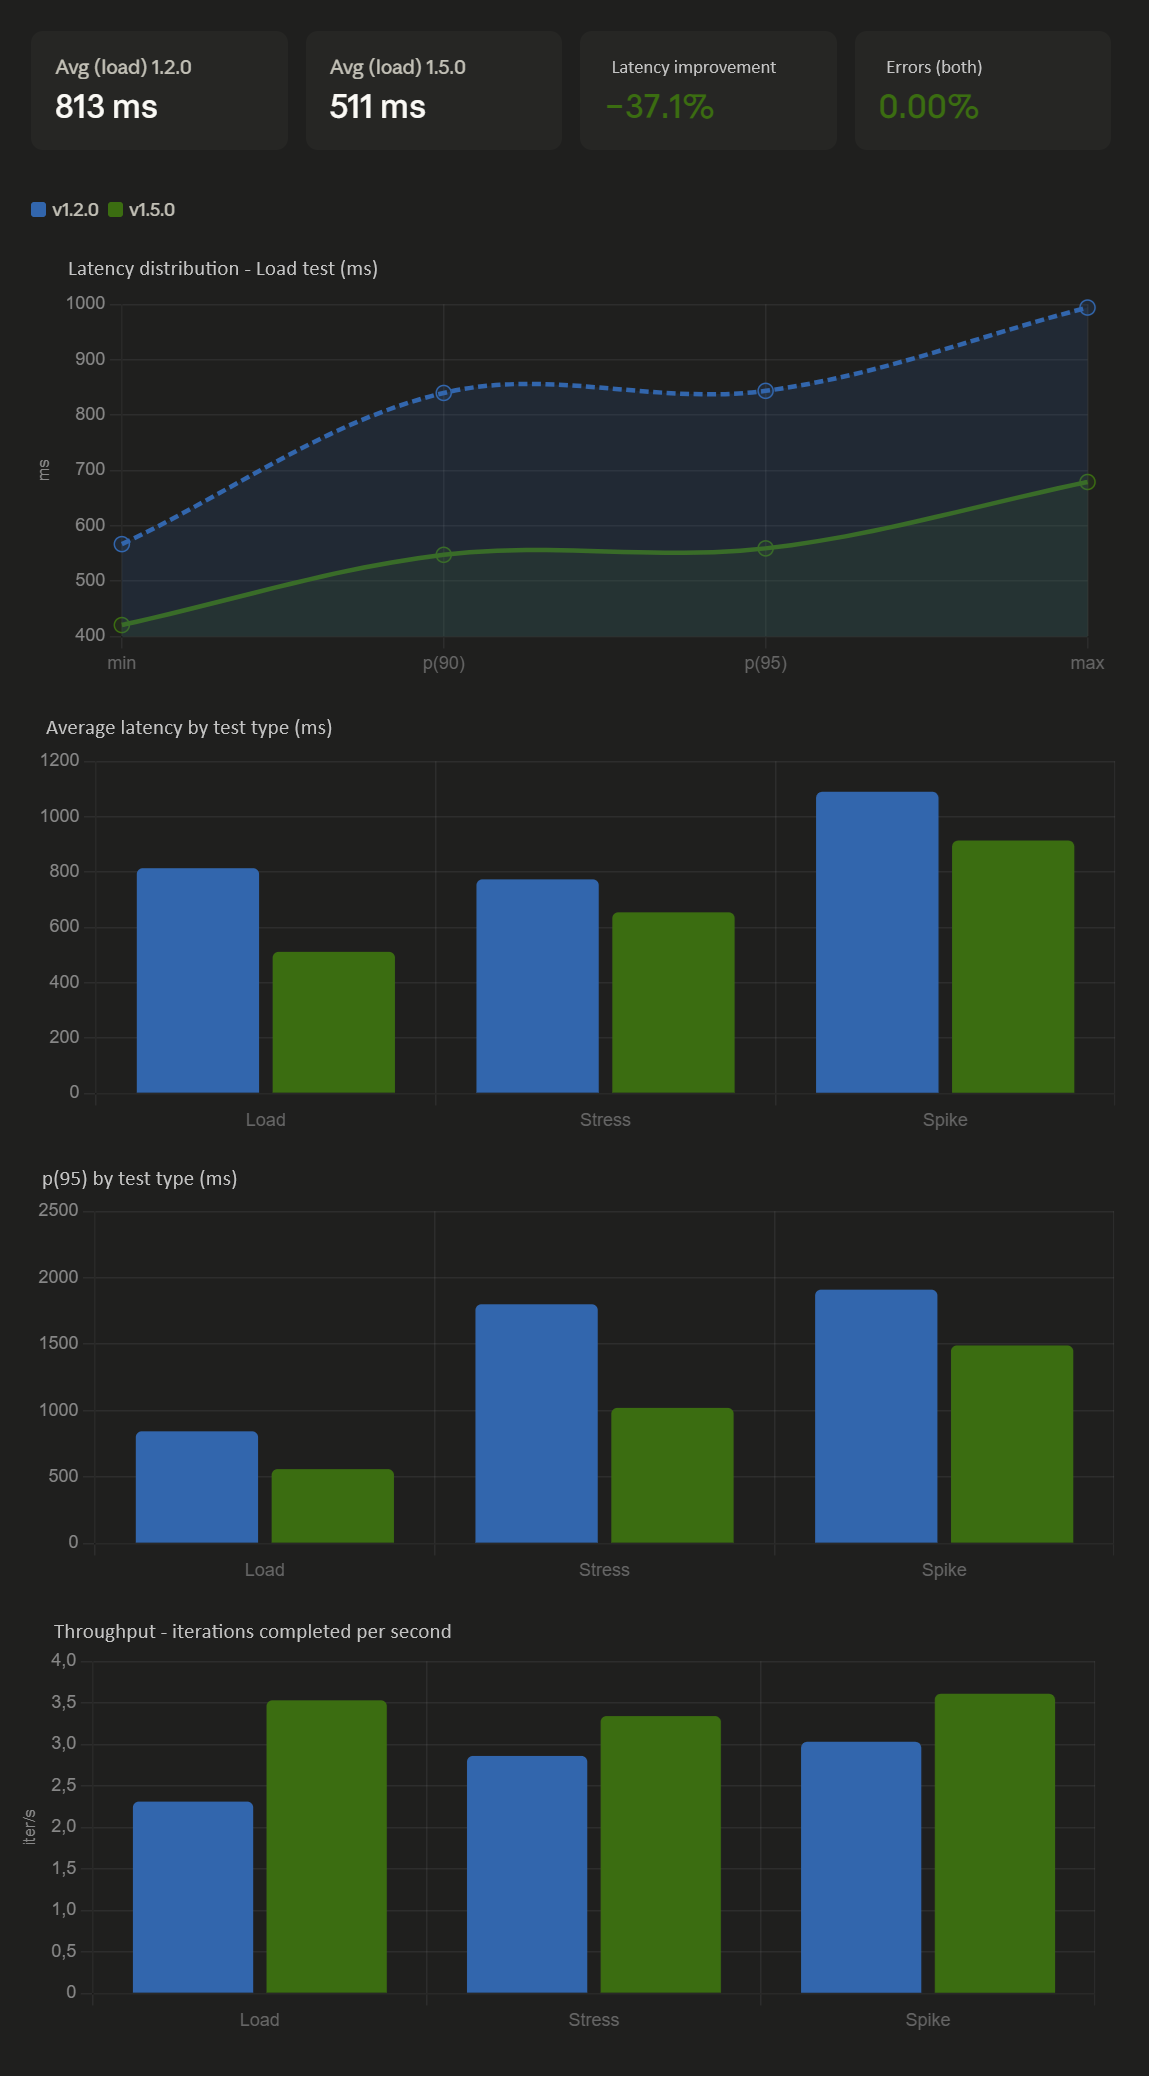
Comparison between version 1.2.0 and 1.5.0
The tests were performed on a 16-core AWS machine, utilizing only 8 cores to ensure that no other processes altered the comparison.
The service's Docker container was run on that machine and K6 was used to perform Load, Stress and Spike tests.
Configuration:
- Environment variable
FACEPHI_SELPHID_FACIALEXTRACTOR_NUM_THREADS=4. - In
config.jsonfile,"number_of_threads": 2.
Summary:
- Version 1.5.0 represents a significant performance improvement over 1.2.0 in all test types.
- Average latency in the load test was reduced by 37%, throughput increased by 53% in the same test, and p(95) percentiles improved steadily.
- Neither version experienced HTTP errors.
Load test table
2 VUs on a loop for 15 minutes.
| Metrics | v1.2.0 | v1.5.0 | Δ |
|---|---|---|---|
| Avg latency | 813.68 ms | 511.41 ms | −37.2 % |
| Min | 566.70 ms | 420.47 ms | −25.8 % |
| Median | 808.75 ms | 510.31 ms | −36.9 % |
| p(90) | 839.83 ms | 547.41 ms | −34.8 % |
| p(95) | 843.65 ms | 559.02 ms | −33.7 % |
| Max | 994.11 ms | 678.97 ms | −31.7 % |
| Total iterations | 2 079 | 3 177 | +52.8 % |
| Throughput | 2.31 iter/s | 3.53 iter/s | +52.8 % |
| Errors HTTP | 0.00 % | 0.00 % | — |
Stress test table
Up to 4 VUs on ramp for 8 min (4 stages).
| Metrics | v1.2.0 | v1.5.0 | Δ |
|---|---|---|---|
| Avg latency | 773.35 ms | 654.23 ms | −15.4 % |
| Min | 424.49 ms | 361.91 ms | −14.7 % |
| Median | 584.56 ms | 540.95 ms | −7.5 % |
| p(90) | 1 250 ms | 994 ms | −20.5 % |
| p(95) | 1 800 ms | 1 020 ms | −43.3 % |
| Max | 1 990 ms | 1 110 ms | −44.2 % |
| Total iterations | 1 376 | 1 607 | +16.8 % |
| Throughput | 2.86 iter/s | 3.34 iter/s | +16.8 % |
| Errors HTTP | 0.00 % | 0.00 % | — |
The most notable improvement under stress occurs at the extremes: p(95) drops by 780 ms and the maximum decreases by almost 44%. This indicates that version 1.5.0 handles concurrency peaks better.
Spike test table
Up to 4 VUs on aggressive ramp for 1 min 40 s (3 stages).
| Metrics | v1.2.0 | v1.5.0 | Δ |
|---|---|---|---|
| Avg latency | 1 090 ms | 913.82 ms | −16.2 % |
| Min | 440.28 ms | 362.44 ms | −17.7 % |
| Median | 715.47 ms | 854.49 ms | +19.4 % |
| p(90) | 1 890 ms | 1 430 ms | −24.3 % |
| p(95) | 1 910 ms | 1 490 ms | −22.0 % |
| Max | 1 960 ms | 1 610 ms | −17.9 % |
| Total iterations | 305 | 363 | +19.0 % |
| Throughput | 3.03 iter/s | 3.61 iter/s | +19.1 % |
| Errors HTTP | 0.00 % | 0.00 % | — |
⚠️ The median latency increases in the peak test of 1.5.0 (715 ms → 854 ms). Although the high percentiles improve, the central distribution worsens slightly below peak.
Global Comparative Summary
| Tipo | Avg 1.2.0 | Avg 1.5.0 | p(95) 1.2.0 | p(95) 1.5.0 | RPS 1.2.0 | RPS 1.5.0 |
|---|---|---|---|---|---|---|
| Load | 813 ms | 511 ms | 843 ms | 559 ms | 2.31 | 3.53 |
| Stress | 773 ms | 654 ms | 1 800 ms | 1 020 ms | 2.86 | 3.34 |
| Spike | 1 090 ms | 914 ms | 1 910 ms | 1 490 ms | 3.03 | 3.61 |